Introduction
Some people have asked how I have used Repast Simphony to create a virtual city in which agents’ movements are restricted to a road network. So here I’ll briefly outline the method I used. I was still very new to Repast when I worked this out so I'm sure there’ll be much more efficient methods, comments/criticisms are welcome.
The basic idea is to create a GIS projection to hold the spatial locations of all the roads and a Network projection to store the topographical relationships between the roads. So if an agent needs to get to a destination we ask the Network projection which roads it has to travel along, then actually plot a course using the GIS projection.
Firstly I’ll outline a bit more about the contexts and projections and then briefly discuss how the agents move around the city.
Creating the city – contexts and projectionsThere are two types of objects I use to represent the road network: Roads and Junctions (or “Intersections” if you prefer). Junctions are created at the points where two roads meet and will form the Nodes in a Network projection. I used two separate contexts to store these objects called: RoadContext and JunctionContext. I also created two GIS projections and a Network projection from these contexts:
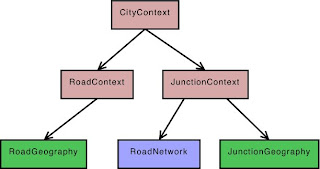
I have used separate contexts because I only want Junction objects in the RoadNetwork projection (they will form the nodes of the network) and couldn't see a way of doing this if Roads and Junctions were kept in the same context.
To read in the road data and add them to the context I saved the road network as an Arc Shapefile and then used
ShapefileLoader. Simphony has made this really easy, it only takes a few lines of code.
To create the Junction objects I iterate over all the Road objects and create a Junction wherever two roads meet. Then I add the Junctions to the JunctionContext (so they are also automatically added to the RoadNetwork projection) and create an edge between them (setting the weight as the distance of the road segment). So now there are Road objects in the RoadGeography and repast edges in the RoadNetwork. It's important to keep a list of roads and edges so we know which road each edge corresponds to, this is how we can link the GIS projection to the Network projection.
That’s all that is required to create the city road network. Now we have the spatial information (the RoadGeography) and topographical information (the RoadNetwork) about the roads. In the next section I’ll outline how to move agents around the city.
Moving around the city I will assume that the agent is starting on a road segment. If the agent isn’t on a road (they could be at home for example) then a few extra steps will be needed to move them onto the nearest road first. The routing algorithm works by firstly building a list of coordinates which the agent must pass through to get to their destination and then moving along the planned route.
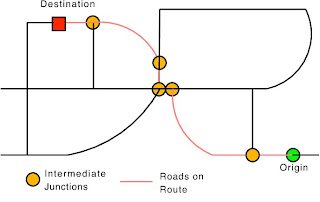
Planning the routeThe following diagram illustrates a hypothetical route and the junctions which the agents will pass through to get between their origin and destination.
The following steps briefly outline how to create a route:
- Find the nearest Junctions to the agent’s starting position and the destination.
- Calculate a list of edges (in the RoadNetwork projection) which make up the bulk of the route (I use the repast.simphony.space.graph.ShortestPath.getPath() function).
- Create a list of coordinates which the agent must pass through to get from the origin to the destination. This is done by:
- Iterating over all the edges which make up the route and:
- Finding the Road object (in the RoadGeography GIS projection) which corresponds to the edge (this is why it is necessary to keep a list of edges and their corresponding road when building the city).
- Adding all the coordinates which make up the geometry of the road to the list.
(If the road network is a true manhattan grid then there are a number of ways of improving the efficiency of the routing algorithm. This is rarely the case in European cities though so I assume the road network is much less ordered and that roads have bends in them. Also, I assume that the agent will want to get to destinations which are part-way along a road segment, if this restriction is removed (so the agent only travels to Junctions) then the algorithm can be made even simpler.)So now the agent will have a list of coordinates which will take the agent from an its origin to its destination, restricted to roads.
MovingMy agents are only allowed to move a certain distance each turn, so the last step which is required is to calculate whether or not the agent can make it all the way to the next coordinate in it’s list and if not, where it will end up. This is fairly straightforward using a vector.
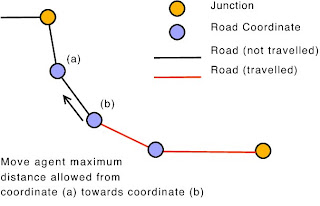
If the agent cannot make it all the way from coordinate (b) to coordinate (a), you can move it the maximum remaining distance it is allowed to travel in the direction of (a). Then in the next iteration it can continue on towards (a) as normal.
That's it, I’m sorry if that isn’t very clear but I hope it will help. Please email me if you have any questions.


