Following on from a previous post about how to move agents around a road network using Repast Simphony, I have just finished developing a prototype version which others can download. The program loads a small hypothetical town with a few simple agents, some houses and some roads. The agents choose a random house and then travel there.
The code and some description about how it works are here. I hope it will be useful for others who are developing agent-based models or crime simulations in particular.
Friday, 8 August 2008
Friday, 11 July 2008
Artificial Crime Analysis Systems book
 I have recently come across this new book, edited by Lin Lui and John Eck: Artificial Crime Analysis Systems: Using Computer Simulations and Geographic Information Systems.
It is a collection of papers by the authors of new agent-based crime models as well as discussions surrounding other issues with crime simulation (such as validation, verification etc). This book is long overdue and very relevant, I recommend it as the first place to look for anyone interested in crime simulation.
Thursday, 10 July 2008
Presentation at the British Society of Criminology conference
I have just given a presentation entitled "Improving burglary-reduction initiatives through a realistic agent-based model." at one of the "Geographies of Crime" sessions, organised by Professor Alex Hirschfield at the University of Huddersfield.
The abstract and slides are on my School of Geography webpage.
The abstract and slides are on my School of Geography webpage.
Thursday, 19 June 2008
Presentation: Realistic Crime Simulation.
I recently attended a workshop at the National Centre for e-Social Science Fourth International Conference and gave a short presentation entitled "Realistic Crime Simulation: Predicting crime rates through a sound model of offender behaviour coupled with an accurate virtual environment" (it can be downloaded from my School of Geography webpage). The abstract is as follows:
Understanding the relationship between crime and the environment is an important research area in criminology. However, human systems are highly complex and influenced by a huge number of individual components, complex spatio-temporal interactions and human decisions which are at best complex and at worst seemingly irrational. As with other human systems, the complexity of the crime system, therefore, makes it extremely difficult to understand and predict crime patterns and to generate effective crime reduction policies.
To credibly model crime it is essential to be able to model the complex, dynamic interactions of the individuals and their environment which constitute a crime event. However, most studies to date suffer from an inability to model these micro-level interactions. Agent-based modelling is a methodology which works from the “bottom-up” and is able to capture emergent phenomena such as city-wide crime patterns which are built up from a multitude of individual crime occurrences. Such techniques are becoming very popular in the fields of urban studies in geography, but are still rarely used in criminology or by policy makers.
This paper will present an advanced agent-based model which couples a realistic framework for modelling offender behaviour with an accurate GIS virtual environment using the Repast Simphony toolset. We will use the model to evaluate and predict the success of genuine crime reduction scenarios implemented in the city of Leeds.
Thursday, 22 May 2008
Visualising Agent Movements with GeoTime
I've recently started using GeoTime (r), produced by Oculus who were kind enough to kind enough to provide a student license. I think the software is intended for the police but it works very well for visualising any type of movement in a space. It's particularly good for analysing the movements of agents. It provides plug-ins for Excel and ArcGIS so it's easy to send model results to GeoTime and then visualise them.
These screen shots* show a burglar agent who is searching for a potential victim. The horizontal axis is used to show movement in space and the vertical axis shows movement over time. You can use Arc to project a map on the spatial plane. The bar at the bottom of the screen allows you to restrict the events to a particular temporal range and it can be dragged to show how movements vary dynamically (will try to make a video of this).


The software is particularly useful for debugging and validation. You can look at the behaviour of the agents very carefully and see if they are behaving as they should. For example, the agent above walked up and down the same street about 10 times. This is probably not accurate and shows that work is needed on the behaviour of the agents to bring it in to line with criminology theory.
You can also use the software to visualise multiple agents. This will be particularly useful when agents can interact because it is easy to see where groups of agents cluster spatially and temporally.

*GeoTime® software used courtesy of Oculus Info Inc. All GeoTime rights reserved.
Friday, 16 May 2008
Repast Simphony "no-GUI" Tutorial
UPDATE (7th March 2013): The link below doesn't work any longer but as the new Repast tutorials have been improved I don't intend to update it. Have a look at the Repast homepage.
I've been using Repast Simphony to build my agent-based crime model. Repast is a tool kit which has lots of really useful functions for organising agents, creating displays, scheduling events, working with GIS data, drawing charts, outputting data etc. Although Simphony is excellent I think there's quite a steep learning curve so I've written a short (1 hour) tutorial which will hopefully help to get people started:
http://portal.ncess.ac.uk/access/wiki/site/mass/simphony%20tutorial.html
Simphony now has a GUI which you can use to build models (the main tutorial goes through how to use this) but I've avoided this, preferring to program models directly.
Friday, 9 May 2008
Using Repast to move agents along a road network
Introduction
Some people have asked how I have used Repast Simphony to create a virtual city in which agents’ movements are restricted to a road network. So here I’ll briefly outline the method I used. I was still very new to Repast when I worked this out so I'm sure there’ll be much more efficient methods, comments/criticisms are welcome.
The basic idea is to create a GIS projection to hold the spatial locations of all the roads and a Network projection to store the topographical relationships between the roads. So if an agent needs to get to a destination we ask the Network projection which roads it has to travel along, then actually plot a course using the GIS projection.
Firstly I’ll outline a bit more about the contexts and projections and then briefly discuss how the agents move around the city.
Creating the city – contexts and projections
There are two types of objects I use to represent the road network: Roads and Junctions (or “Intersections” if you prefer). Junctions are created at the points where two roads meet and will form the Nodes in a Network projection. I used two separate contexts to store these objects called: RoadContext and JunctionContext. I also created two GIS projections and a Network projection from these contexts:
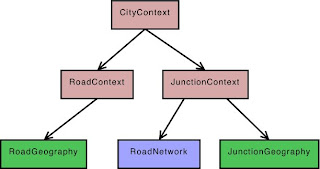
I have used separate contexts because I only want Junction objects in the RoadNetwork projection (they will form the nodes of the network) and couldn't see a way of doing this if Roads and Junctions were kept in the same context.
To read in the road data and add them to the context I saved the road network as an Arc Shapefile and then used ShapefileLoader. Simphony has made this really easy, it only takes a few lines of code.
To create the Junction objects I iterate over all the Road objects and create a Junction wherever two roads meet. Then I add the Junctions to the JunctionContext (so they are also automatically added to the RoadNetwork projection) and create an edge between them (setting the weight as the distance of the road segment). So now there are Road objects in the RoadGeography and repast edges in the RoadNetwork. It's important to keep a list of roads and edges so we know which road each edge corresponds to, this is how we can link the GIS projection to the Network projection.
That’s all that is required to create the city road network. Now we have the spatial information (the RoadGeography) and topographical information (the RoadNetwork) about the roads. In the next section I’ll outline how to move agents around the city.
Moving around the city
I will assume that the agent is starting on a road segment. If the agent isn’t on a road (they could be at home for example) then a few extra steps will be needed to move them onto the nearest road first. The routing algorithm works by firstly building a list of coordinates which the agent must pass through to get to their destination and then moving along the planned route.
Planning the route
The following diagram illustrates a hypothetical route and the junctions which the agents will pass through to get between their origin and destination.
The following steps briefly outline how to create a route:
So now the agent will have a list of coordinates which will take the agent from an its origin to its destination, restricted to roads.
Moving
My agents are only allowed to move a certain distance each turn, so the last step which is required is to calculate whether or not the agent can make it all the way to the next coordinate in it’s list and if not, where it will end up. This is fairly straightforward using a vector.
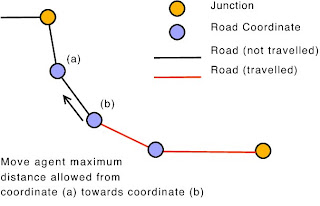
If the agent cannot make it all the way from coordinate (b) to coordinate (a), you can move it the maximum remaining distance it is allowed to travel in the direction of (a). Then in the next iteration it can continue on towards (a) as normal.
That's it, I’m sorry if that isn’t very clear but I hope it will help. Please email me if you have any questions.
Some people have asked how I have used Repast Simphony to create a virtual city in which agents’ movements are restricted to a road network. So here I’ll briefly outline the method I used. I was still very new to Repast when I worked this out so I'm sure there’ll be much more efficient methods, comments/criticisms are welcome.
The basic idea is to create a GIS projection to hold the spatial locations of all the roads and a Network projection to store the topographical relationships between the roads. So if an agent needs to get to a destination we ask the Network projection which roads it has to travel along, then actually plot a course using the GIS projection.
Firstly I’ll outline a bit more about the contexts and projections and then briefly discuss how the agents move around the city.
Creating the city – contexts and projections
There are two types of objects I use to represent the road network: Roads and Junctions (or “Intersections” if you prefer). Junctions are created at the points where two roads meet and will form the Nodes in a Network projection. I used two separate contexts to store these objects called: RoadContext and JunctionContext. I also created two GIS projections and a Network projection from these contexts:

I have used separate contexts because I only want Junction objects in the RoadNetwork projection (they will form the nodes of the network) and couldn't see a way of doing this if Roads and Junctions were kept in the same context.
To read in the road data and add them to the context I saved the road network as an Arc Shapefile and then used ShapefileLoader. Simphony has made this really easy, it only takes a few lines of code.
To create the Junction objects I iterate over all the Road objects and create a Junction wherever two roads meet. Then I add the Junctions to the JunctionContext (so they are also automatically added to the RoadNetwork projection) and create an edge between them (setting the weight as the distance of the road segment). So now there are Road objects in the RoadGeography and repast edges in the RoadNetwork. It's important to keep a list of roads and edges so we know which road each edge corresponds to, this is how we can link the GIS projection to the Network projection.
That’s all that is required to create the city road network. Now we have the spatial information (the RoadGeography) and topographical information (the RoadNetwork) about the roads. In the next section I’ll outline how to move agents around the city.
Moving around the city
I will assume that the agent is starting on a road segment. If the agent isn’t on a road (they could be at home for example) then a few extra steps will be needed to move them onto the nearest road first. The routing algorithm works by firstly building a list of coordinates which the agent must pass through to get to their destination and then moving along the planned route.
Planning the route
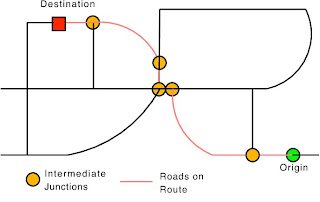
The following diagram illustrates a hypothetical route and the junctions which the agents will pass through to get between their origin and destination.

The following steps briefly outline how to create a route:
- Find the nearest Junctions to the agent’s starting position and the destination.
- Calculate a list of edges (in the RoadNetwork projection) which make up the bulk of the route (I use the repast.simphony.space.graph.ShortestPath.getPath() function).
- Create a list of coordinates which the agent must pass through to get from the origin to the destination. This is done by:
- Iterating over all the edges which make up the route and:
- Finding the Road object (in the RoadGeography GIS projection) which corresponds to the edge (this is why it is necessary to keep a list of edges and their corresponding road when building the city).
- Adding all the coordinates which make up the geometry of the road to the list.
So now the agent will have a list of coordinates which will take the agent from an its origin to its destination, restricted to roads.
Moving
My agents are only allowed to move a certain distance each turn, so the last step which is required is to calculate whether or not the agent can make it all the way to the next coordinate in it’s list and if not, where it will end up. This is fairly straightforward using a vector.

If the agent cannot make it all the way from coordinate (b) to coordinate (a), you can move it the maximum remaining distance it is allowed to travel in the direction of (a). Then in the next iteration it can continue on towards (a) as normal.
That's it, I’m sorry if that isn’t very clear but I hope it will help. Please email me if you have any questions.
Sunday, 27 April 2008
Introduction - My Prototype Burglary Model
The aim of my research is to build an accurate agent-based model which we can use to predict rates of residential burglary. Potential burglars in the model will be represented by agents and they will be as realistic as possible, drawing from studies in criminology and artificial intelligence. The virtual environment will also be realistic by incorporating GIS data from the area of study (the city of Leeds at the moment but the model will be flexible enough to be applied to any city).
I've just finished the GIS version of my prototype using Repast Simphony, here's a short video showing the simple burglar agents moving around their environment (part of East Leeds).
This is a prototype at the moment, so the behaviour of the agents and the virtual environment are both relatively simple. The model is still able to produce crime hotspots which appear similar to those we find in real data (I haven't done any proper statistical analysis yet). These images show some preliminary model results and clusters produced by analysing real burglary data:

To model human behaviour I'm using the PECS framework (Physical Conditions, Emotional States, Cognitive Capabilities and Social Status) and I'm using Mastermap GIS data along with census boundaries and statistics to describe houses and local communities. I'm using findings from criminology to make the model as realistic as possible, both from the point-of-view of how the burglars should behave and which aspects of the environment are important to a potential burglar. I'm hoping to publish a couple of papers which have more details about the model, one is in review at the moment.
I'm working in the School of Geography at the University of Leeds and I'm part of the Centre for Spatial Analysis and Policy (CSAP) research cluster. We're working closely with Safer Leeds the crime and disorder reduction partnership. They are kindly supplying a range of data from essential crime statistics to detailed information about their crime-reduction projects. If anyone has any comments / criticisms / suggestions about the work please either email me (my address is on the school website) or leave comments here.
The Environment
In my model, the environment will be made up of three layers:

The community layer is designed to bring in all the aspects of a neighbourhood which will influence how a potential burglar behaves. This layer consists of four sub-layers which will each influence a potential burglar differently. Collective efficacy (or community spirit) is designed to give an idea of how likely it is that people in the neighbourhood will notice an outsider and keep an eye on them, a highly cohesive neighbourhood will make a burglar agent more cautious. In general, criminologists have found that a high collective efficacy is inversely proportional to crime rates. Attractiveness gives an estimation of the abundance of goods available to a potential burglary (student households, for example, often have lots of expensive goods in them). The final two layers: traffic volume and occupancy are designed to give an estimate of how busy the area is. If there are lots of passers-by it will be more difficult to break into a property unnoticed and many burglars have expressed a preference for empty houses so they will not have to confront the owners. Most of the data for these layers can be gathered from the (2001) UK census.
The individual property layer provides individual information about each potential victim (household). For UK studies I will be using mastermap data which is a detailed, individual-level GIS dataset containing information about roads, buildings, parks etc. By analysing of each individual house it is possible to estimate the number of possible entrances to the property (a terraced house, for example, will usually have fewer possible entrances than a detached house) and how visible the property is to its' neighbours. This figure shows some of the different features available as part of the Topographic Layer.

Finally, the transport layer will be used by the agents to move around the environment. Different methods will include public transport, walking and driving. This will be particularly useful for policy scenarios. For example, it might be useful to ask "what might happen to burglary rates in this area if we built this new rapid-transit line".
Burglar Agents
Potential burglars are the only agents in the model. The actions of other important actors (passers-by, residents etc) can be simulated in the virtual environment. To make the agents as realistic as possible the research will draw on findings from criminology and use an advanced behavioural framework to model their behaviour.
I've just finished the GIS version of my prototype using Repast Simphony, here's a short video showing the simple burglar agents moving around their environment (part of East Leeds).
This is a prototype at the moment, so the behaviour of the agents and the virtual environment are both relatively simple. The model is still able to produce crime hotspots which appear similar to those we find in real data (I haven't done any proper statistical analysis yet). These images show some preliminary model results and clusters produced by analysing real burglary data:

To model human behaviour I'm using the PECS framework (Physical Conditions, Emotional States, Cognitive Capabilities and Social Status) and I'm using Mastermap GIS data along with census boundaries and statistics to describe houses and local communities. I'm using findings from criminology to make the model as realistic as possible, both from the point-of-view of how the burglars should behave and which aspects of the environment are important to a potential burglar. I'm hoping to publish a couple of papers which have more details about the model, one is in review at the moment.
I'm working in the School of Geography at the University of Leeds and I'm part of the Centre for Spatial Analysis and Policy (CSAP) research cluster. We're working closely with Safer Leeds the crime and disorder reduction partnership. They are kindly supplying a range of data from essential crime statistics to detailed information about their crime-reduction projects. If anyone has any comments / criticisms / suggestions about the work please either email me (my address is on the school website) or leave comments here.
The Environment
In my model, the environment will be made up of three layers:
- The "community" or "neighbourhood" layer
- Individual properties
- Transport

The community layer is designed to bring in all the aspects of a neighbourhood which will influence how a potential burglar behaves. This layer consists of four sub-layers which will each influence a potential burglar differently. Collective efficacy (or community spirit) is designed to give an idea of how likely it is that people in the neighbourhood will notice an outsider and keep an eye on them, a highly cohesive neighbourhood will make a burglar agent more cautious. In general, criminologists have found that a high collective efficacy is inversely proportional to crime rates. Attractiveness gives an estimation of the abundance of goods available to a potential burglary (student households, for example, often have lots of expensive goods in them). The final two layers: traffic volume and occupancy are designed to give an estimate of how busy the area is. If there are lots of passers-by it will be more difficult to break into a property unnoticed and many burglars have expressed a preference for empty houses so they will not have to confront the owners. Most of the data for these layers can be gathered from the (2001) UK census.
The individual property layer provides individual information about each potential victim (household). For UK studies I will be using mastermap data which is a detailed, individual-level GIS dataset containing information about roads, buildings, parks etc. By analysing of each individual house it is possible to estimate the number of possible entrances to the property (a terraced house, for example, will usually have fewer possible entrances than a detached house) and how visible the property is to its' neighbours. This figure shows some of the different features available as part of the Topographic Layer.

Finally, the transport layer will be used by the agents to move around the environment. Different methods will include public transport, walking and driving. This will be particularly useful for policy scenarios. For example, it might be useful to ask "what might happen to burglary rates in this area if we built this new rapid-transit line".
Burglar Agents
Potential burglars are the only agents in the model. The actions of other important actors (passers-by, residents etc) can be simulated in the virtual environment. To make the agents as realistic as possible the research will draw on findings from criminology and use an advanced behavioural framework to model their behaviour.
Subscribe to:
Posts (Atom)